Large Regional Municipality
Using data engineering and visualization to improve road safety for a large municipality in Canada.
For this Large Regional Municipality, ensuring that the 1 million plus residents can walk and drive safely is top of mind. Spanning 2,000 km^2, the Municipality’s employees are tasked with ensuring residents and visitors are not exposed to unnecessary risks on the roads. The key to this is knowing where the trouble areas are and what is happening at these locations to cause the issues.
The Challenge
Of the Municipality groups who had an interest in learning more about collisions within the region, only one had access to the data they needed. The remaining groups were forced to either rely on an annual Excel report or go through multiple channels to request the one-off report they needed. For them, just getting access to this data was a new and exciting concept, let alone a self-serve dashboard that would simplify the process.
Through requirements gathering, it became clear that even though the stakeholders were involved in different areas of business, they all had the same top questions:
- “Where are accidents happening?”
- “When are accidents happening?”
- “Why are accidents happening?”
- “What kind of accidents are causing the most fatalities?”
Seemingly simple questions, but without timely access to the right data, the answers remained a mystery to the people who had the power to solve the problems.
Our Approach
With winter weather fast approaching, the team had only two months to complete the database and dashboard work needed to help Municipality employees address critical safety issues on the roads.
The project was implemented with the use of the Microsoft SQL Server, SQL Server Integration Services (SSIS), SQL Server Analysis Services (SSAS), and Power BI Report Server.’
Within the short timeframe, the team was able to:
- Implement a normalized data model from an Oracle data environment, consolidating collision data, with regional asset data and geolocation attributes.
- Create a data layer (using a tabular model in SSAS) for the dashboard and as a shared data source for other departments to consume in their own reports.
- Improve query performance by de-normalizing collision data.
- Fulfill the requirement to minimize custom coding by using SSIS for data import and transformation processes.
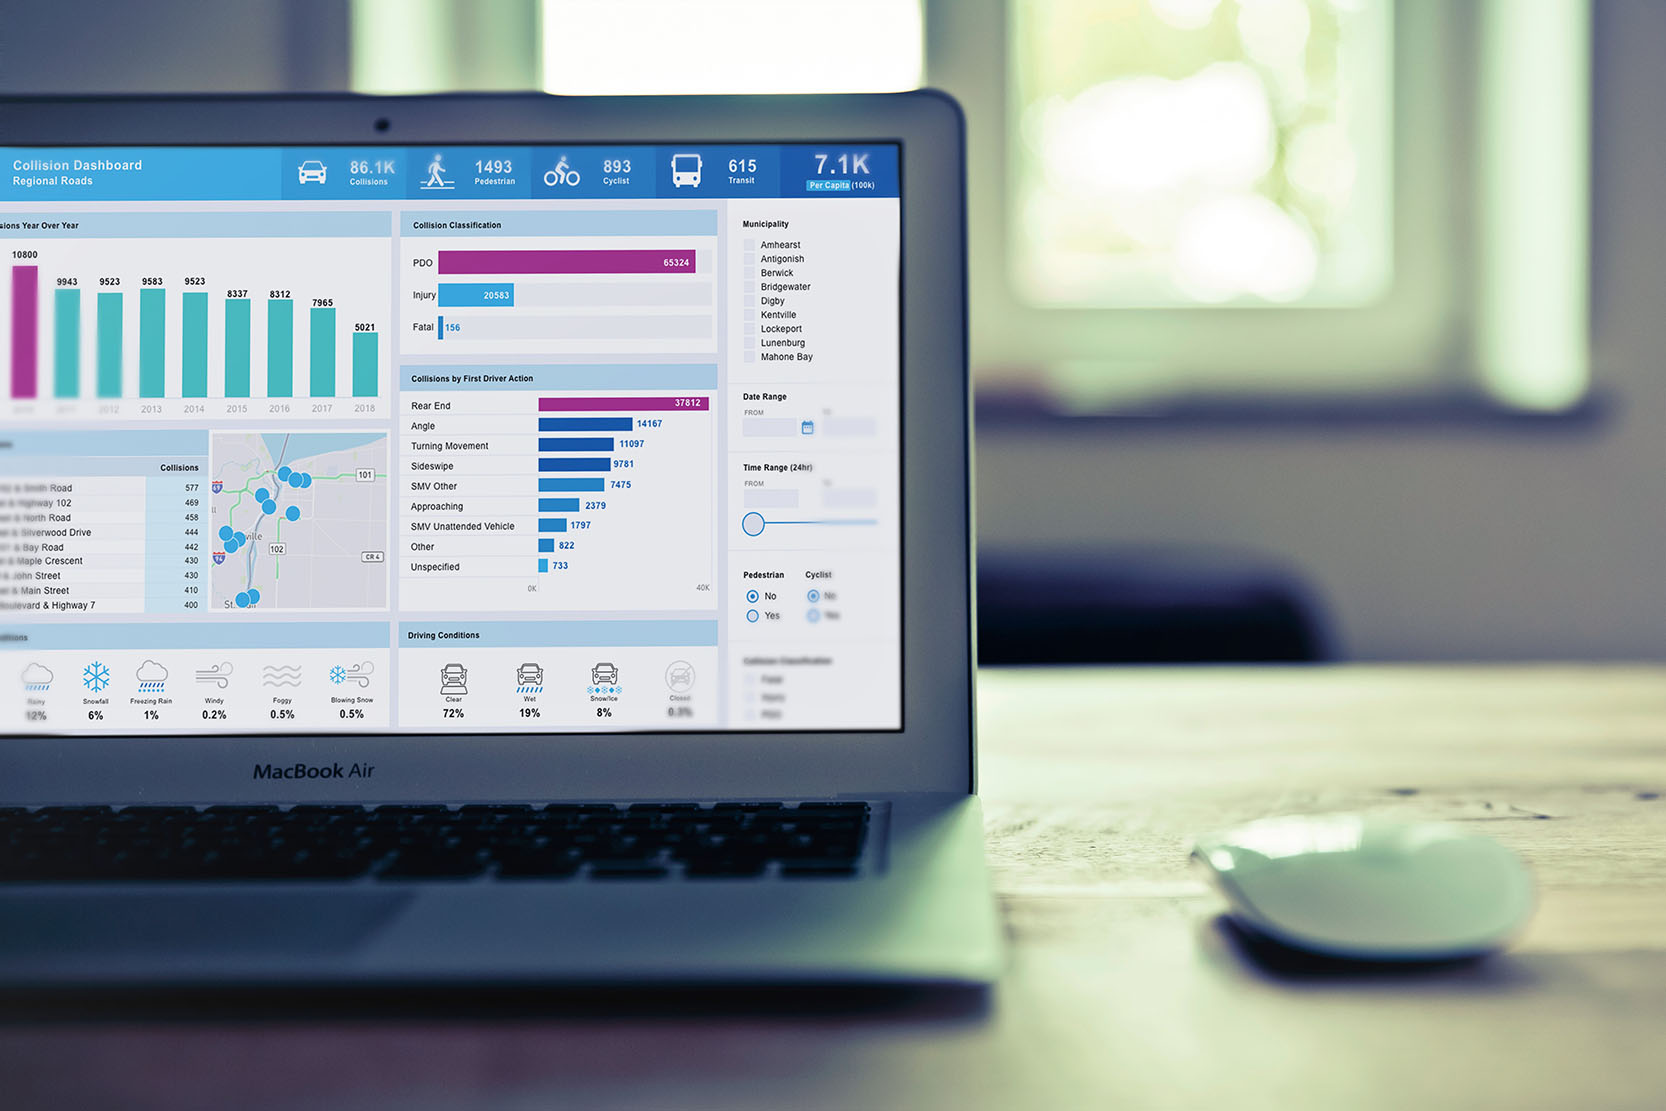
- Design and build a Power BI dashboard presenting collision data and weather conditions to the client using bookmarks and selections to provide a better experience for the end user.
- Incorporate Synoptic Panel to present the data in an attractive way without sacrificing functionality.

Results
The team delivered the dashboard in under 8 weeks, empowering Municipality employees to better understand important safety factors, such as:
- what drivers are doing when accidents occur (drinking, texting, speeding, normal driving, etc.)
- road conditions at the time of accidents
- environmental conditions
- types of collisions (approaching, rear-ending, turning, hitting a parked car, etc.)
The Power BI dashboard was immediately adopted and lauded by end-users, garnering rave reviews from the Director of Transportation and the Commissioner of the Region. Stakeholders at all levels were thrilled to finally have the ability to access and analyze road safety data to make better decisions.
“Great work everyone! You delivered a lot of functionality in a short period of time. We have been interested in digging into these metrics and now we have the ability. Looking forward to the continued momentum!”
– Feedback from Municipality employees
Work continues with the Municipality, with several exciting projects in the pipeline, including a series of dashboards and reports pertaining to winter road maintenance.